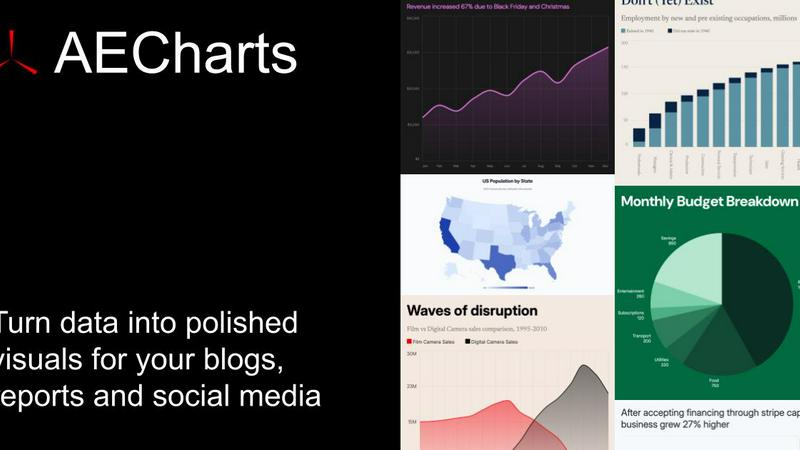
AECharts
AECharts lets you create stunning animated charts effortlessly, transforming your data into eye-catching videos for presentations and social media.
About AECharts
AECharts is your go-to browser-based tool for whipping up stunning animated chart videos without breaking a sweat. No design skills? No problem! Forget about cumbersome software installations or tedious video editing—this clever tool allows you to transform raw data into eye-catching visual stories in mere minutes. Whether you’re a marketer, journalist, researcher, or founder, AECharts empowers you to communicate complex data clearly and effectively. Just upload a spreadsheet, paste your data, or link a Google Sheet, and watch as AECharts conjures up a polished animated video. With a variety of chart types like bar charts, line charts, pie charts, and even bar chart races, you can choose from a rich array of professional templates that you can customize to reflect your unique style. When you’re done, export your creation as an MP4 and share it across platforms like YouTube, LinkedIn, TikTok, and more. Animated charts not only look cooler but also significantly boost engagement compared to static images. AECharts makes producing these dynamite visuals as easy as taking a screenshot!
Features of AECharts
Animated Chart Creation
Every chart you craft is inherently a video. No extra tools or software necessary. Just create, customize, and voila—your animated chart is ready for the spotlight!
Brand Kit Integration
Your brand identity matters, and AECharts gets that. Automatically apply your brand's fonts, colors, and logos to every chart, ensuring a cohesive look that screams professionalism and style.
Flexible Export Options
AECharts offers versatile export formats including JPEG, PNG, and MP4, so you can easily adapt your charts for reports, presentations, or social media. Choose from various sizes and presets to fit your needs perfectly.
Extensive Chart Variety
With 14 chart types and counting—including bar, line, pie, and scatter—plus unique options like bar chart races and gauge charts, AECharts has the tools to visualize any data story you want to tell.
Use Cases of AECharts
Marketing Campaign Metrics
Marketers can leverage AECharts to create compelling animated charts showcasing campaign performance. Visualizing key metrics not only grabs attention but also simplifies complex data for better stakeholder communication.
Data Journalism
Journalists can use AECharts to transform statistics and data points into animated videos that tell a story. This dynamic approach keeps readers engaged and helps present findings in an easily digestible format.
Research Presentations
Researchers can elevate their presentations by incorporating animated charts to illustrate their findings. The ability to customize colors and branding ensures that every presentation stands out and resonates with the audience.
Social Media Engagement
Social media managers can create vibrant animated charts to share insights and trends. With platforms like TikTok and Instagram favoring engaging video content, AECharts is the perfect tool to catch the eye of followers.
Frequently Asked Questions
What is AECharts?
AECharts is a browser-based tool designed to help users create animated charts quickly and effortlessly. It’s perfect for anyone needing to visualize data without extensive design or coding skills.
Who is this tool designed for?
AECharts caters to a wide range of users, including marketers, journalists, researchers, and founders. Anyone who needs to communicate data effectively will find AECharts invaluable.
Do I need coding or design skills to use it?
Absolutely not! AECharts is built for everyone, regardless of technical skills. The intuitive interface makes it easy to create stunning charts without any prior experience.
Can I import data from CSV or spreadsheets?
Yes! AECharts allows you to easily import data from Excel, Google Sheets, or CSV files. Just paste your data, and you’re ready to start creating your animated chart.
Similar to AECharts
Anime Maker
Create anime images, characters, logos, filters, and image-to-video concepts with AI.
ComicsMaker
AI comic generator that turns ideas, scripts, and prompts into polished comic panels and visual stories online.
MagicShot AI
MagicShot.ai is where creators, job seekers & businesses make visual content with AI, photoshoots, image generation, videos & edits from a single upl
Seedream AI Studio
Generate images with Seedream 5.0 and turn selected results into short videos in one browser workflow.
Inkfox AI
Inkfox AI is a free unlimited AI image generator requiring no sign-up, featuring Nano Banana 2.0, GPT Image 2.0, Flux, and Seedream models
The CAD Hub
CadHub is a searchable directory of CAD, CAM, CAE, PLM, and engineering software that helps users compare tools, pricing, deployment options, and ke
Grok Imagine AI
Grok Imagine AI transforms your ideas into stunning images and videos in minutes, perfect for ads, social media, and creative projects.