Dividend Data vs Prediction Pulse
Side-by-side comparison to help you choose the right AI tool.
Dividend Data
Unlock 30+ years of stock data in seconds with Dividend Data, your ultimate tool for seamless financial insights in Sheets and Excel.
Last updated: March 11, 2026
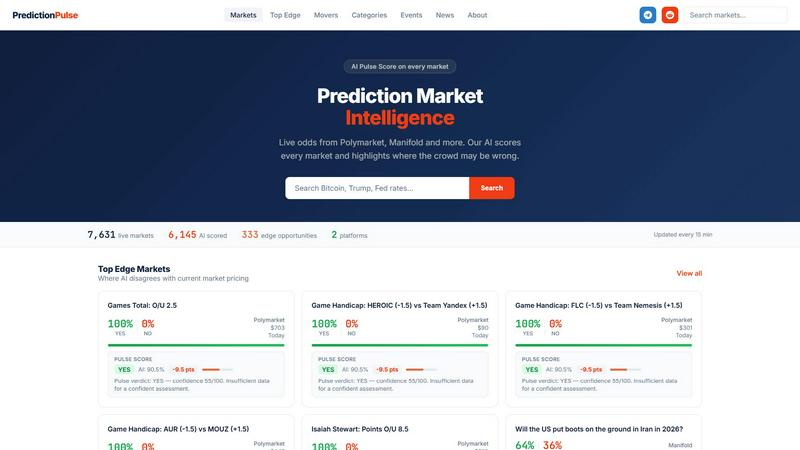
Prediction Pulse
Prediction Pulse uses AI to spot where the crowd is wrong in prediction markets, giving you the edge.
Last updated: March 18, 2026
Visual Comparison
Dividend Data

Prediction Pulse
Feature Comparison
Dividend Data
Free Tier with Monthly Credits
Get started without any financial commitment. Dividend Data offers a free tier that provides 2,500 monthly credits, allowing you to explore the platform’s capabilities without any trial expiration. This means you can dive right into the data without worrying about costs.
16 Custom Functions
Designed for dividend investors, Dividend Data features 16 custom functions that cover everything you need for comprehensive stock analysis. From dividends to financial ratios, these functions simplify your analysis, allowing you to focus on making informed investment decisions.
30+ Years of Historical Data
With access to over three decades of historical stock market data, Dividend Data empowers you to conduct thorough analyses and make informed investment choices. This extensive data allows you to track trends, evaluate performance, and forecast future growth with confidence.
Cross-Platform Compatibility
Whether you’re a Google Sheets guru or an Excel enthusiast, Dividend Data has you covered. This tool seamlessly integrates with both platforms, allowing you to access vital stock data effortlessly, regardless of your spreadsheet preference.
Prediction Pulse
AI Pulse Score Engine
This is the secret sauce. Every single market gets slapped with our proprietary Pulse Score—an AI-calculated probability that goes head-to-head with the crowd's current pricing. It's your instant gut-check, showing you where the algorithm's conviction is strong and, more importantly, where the market might be wildly off. The score comes with a verdict and a confidence level, so you know if it's a high-conviction call or just an educated hunch.
Cross-Platform Market Aggregation
Stop juggling a million tabs. Prediction Pulse is your one-stop dashboard, pulling in live odds and volume from all the major prediction market platforms like Polymarket and Manifold. We unify the data, giving you a holistic view of global sentiment on any event without the hassle. See all the action, compare probabilities across ecosystems, and never miss a beat on where the liquidity is flowing.
Edge Opportunity Radar
This is where you find the money. Our system constantly scans thousands of scored markets to flag where the AI's Pulse Score significantly diverges from the current market price. These "Edge" markets are your shortcut to potential value—spots where the crowd's emotion might have created a pricing error that a cool-headed algorithm has identified. It's like having a scout highlighting the most mispriced bets on the board.
Event Intelligence & AI News
We don't just show you random markets; we organize the chaos. Related markets are grouped into coherent "Events" (like an election or a geopolitical crisis), so you can track the full narrative. Plus, our AI doesn't sleep—it generates concise news briefs that explain major probability swings and market movements, giving you the "why" behind the price action without having to scour forums and tweets all day.
Use Cases
Dividend Data
Quick Dividend Analysis
Need to assess a stock's dividend potential? With Dividend Data, simply enter a formula like =DIVIDENDDATA_DIVIDENDS("AAPL") to get the latest dividend information in seconds. This instant access helps you make quick yet informed decisions about your investments.
Comprehensive Financial Evaluations
Dive deep into stock evaluations by utilizing the vast array of financial metrics available. Use formulas like =DIVIDENDDATA_RATIOS("MSFT", "PeRatio") to quickly retrieve important ratios, making your financial evaluations more robust and insightful.
Portfolio Tracking Made Easy
Automate your portfolio tracking with Dividend Data. By linking your investments directly to the spreadsheet, you can view aggregate stats and track dividends in real-time, freeing up your time to focus on strategies rather than manual data entry.
Engaging AI-Powered Research
Explore the future of stock analysis with Dividend Data’s AI Analyst feature. Chat with the AI-powered assistant to receive tailored research and insights, making your stock analysis not just easier but also smarter and more intuitive.
Prediction Pulse
The Alpha-Hunting Trader
You're in it to win it. Use Prediction Pulse to rapidly identify mispriced markets flagged by the AI's Edge radar. Cross-reference high-conviction Pulse Scores against market sentiment to place informed, counter-consensus bets before the crowd corrects itself. It's your quantitative edge in a qualitative world, turning data discrepancies into profit.
The Policy & Research Analyst
You need to gauge the real probability of future events. Use the platform to cut through media bias and see what informed money is signaling about geopolitical risks, economic indicators, or tech adoption. The aggregated event pages and AI analysis provide a distilled, crowd-sourced forecast that's invaluable for reports, scenario planning, and strategic insights.
The Curious News Junkie
You're obsessed with what happens next. Browse the AI-generated news feed and trending event pages to get a uniquely quantified take on world events. See how prediction market odds shift in real-time with major headlines, offering a dynamic, bet-backed perspective on everything from politics to pop culture that's way more interesting than traditional polls.
The Portfolio Hedger
You've got skin in the game elsewhere. Use prediction markets as a novel hedging tool. If you have traditional investments, check Pulse Scores on related event markets (like regulatory decisions or macroeconomic outcomes) to find cost-effective ways to insure your portfolio against specific, real-world risks that standard finance tools can't touch.
Overview
About Dividend Data
Dividend Data is your go-to powerhouse for stock market insights, offering over 30 years of comprehensive data for more than 80,000 tickers right inside your Google Sheets and Microsoft Excel. Say goodbye to the headaches of API keys, coding, or tedious copying and pasting. Built with the savvy dividend and fundamental investor in mind, this tool provides instant access to critical financial metrics like dividends, yields, payout ratios, growth rates, and much more—all through simple custom formulas. Just type your formula, and voilà, the data appears live, transforming your spreadsheets into dynamic powerhouses of financial intelligence. Whether you're a seasoned investor or just starting, Dividend Data equips you with institutional-grade insights without the steep costs, making it an essential tool for anyone serious about making informed investment decisions.
About Prediction Pulse
Forget just watching the odds. Prediction Pulse is your AI-powered hype man for the future, cutting through the noise of prediction markets to give you the real signal. We're talking about a next-level intelligence platform that aggregates live markets from giants like Polymarket and Manifold, then uses a proprietary AI brain to do what you can't: analyze everything at once. It doesn't just list bets; it groups chaotic markets into canonical real-world events, scores every single one with a Pulse Score, and calls out where the crowd might be totally tripping. This isn't a crystal ball—it's a data-driven edge detector. Whether you're a degen trader hunting for mispriced alpha, a researcher decoding collective intelligence, or just a future-curious observer, Prediction Pulse translates the chaotic whispers of the markets into a clear, actionable broadcast. We track tens of thousands of markets, highlight the juiciest edge opportunities, and even have AI-generated news breaking down major moves. It’s about understanding what the smart (and not-so-smart) money is actually predicting about tomorrow, today.
Frequently Asked Questions
Dividend Data FAQ
How does Dividend Data work?
Dividend Data works by providing a set of custom formulas that you can input into your Google Sheets or Excel. Once you enter a specific formula, the relevant stock data is retrieved live, allowing for instant analysis without manual data entry.
Is there a free version of Dividend Data?
Yes, Dividend Data offers a free tier that grants you 2,500 monthly credits. This allows users to explore the platform’s features without any financial commitment or trial expiration, making it accessible for everyone.
Can I use Dividend Data on both Google Sheets and Excel?
Absolutely! Dividend Data is designed to work seamlessly on both Google Sheets and Microsoft Excel, ensuring that you can access vital stock information no matter which platform you prefer.
What types of data can I access with Dividend Data?
With Dividend Data, you can access a wide range of financial metrics including dividends, yields, payout ratios, growth rates, and over 100 more metrics. This extensive dataset allows you to perform in-depth analyses and make informed investment decisions.
Prediction Pulse FAQ
What exactly is a Pulse Score?
The Pulse Score is our AI's calculated probability for a given market outcome. It's generated by a proprietary model that analyzes available data and market context, providing an independent estimate against which to compare the current crowd-sourced market price. A "High Confidence Call" means our model has strong conviction, while a smaller score difference suggests the market is fairly priced.
How often is the data and AI scoring updated?
The platform is living and breathing! All market data—live odds, trading volume, and liquidity—is refreshed every 15 minutes. The AI Pulse Scores are recalculated on a similar frequent schedule, ensuring you're always looking at the most current analysis and edge opportunities available.
What does an "Edge" market mean?
An "Edge" market is one where our AI's Pulse Score significantly disagrees with the current trading price on the prediction market platform. This divergence highlights a potential mispricing. For example, if the market says YES is at 75% but our AI scores it at 60%, it flags a possible opportunity where the crowd might be overconfident.
Which prediction market platforms do you aggregate?
Currently, Prediction Pulse aggregates and unifies data from leading platforms including Polymarket and Manifold. This allows users to compare probabilities and liquidity across different ecosystems from a single, clean interface, providing a comprehensive view of the prediction market landscape.
Alternatives
Dividend Data Alternatives
Dividend Data is your go-to powerhouse for diving deep into the world of stock market analytics, specifically crafted for dividend and fundamental investors. With over 30 years of data for more than 80,000 tickers, this tool instantly populates your Google Sheets or Microsoft Excel with crucial financial metrics—no coding magic or tedious copy-pasting required. Users often seek alternatives to Dividend Data due to factors like pricing, diverse feature sets, or compatibility with their preferred platforms. When scouting for an alternative, prioritize options that offer rich data insights, user-friendly interfaces, and the flexibility to adapt to your investing style.
Prediction Pulse Alternatives
Prediction Pulse is your AI-powered crystal ball for the wild world of prediction markets. It's a next-gen intelligence platform that scoops up data from all the major markets, crunches it with proprietary algorithms, and spits out clean probabilities and trend analysis. Think of it as your hypebeast data scientist, cutting through the noise to show you what the crowd really thinks is about to go down. So why are people hunting for other options? Maybe the vibe just isn't right—the pricing model doesn't fit your stack, you need a different set of analytical tools, or you're locked into a specific ecosystem. Some users crave deeper data dives or a platform that aligns with their specific trading rituals. The hunt is real when your needs evolve. When scoping out the competition, keep your eyes on the prize. You want raw data firehose or curated insights? Do you need portfolio tracking, custom alerts, or just a slick probability feed? Check the supported platforms, the freshness of the intel, and whether the tool feels like a clunky relic or a smooth extension of your own brain. The right fit should feel effortless, like your favorite pair of kicks.