
StatPecker
StatPecker transforms your data into stunning visuals and instant insights, making storytelling effortless and.
About StatPecker
StatPecker is the ultimate AI-powered tool designed to transform your raw data into eye-popping visuals that grab attention and tell compelling stories. Say goodbye to drowning in endless spreadsheets and wasting cash on expensive designers. Whether you're a marketer looking to showcase campaign ROI, a journalist racing against tight deadlines, a researcher sifting through heaps of CSV files, or an educator breaking down complex concepts, StatPecker is your go-to sidekick. It streamlines the data storytelling process, allowing you to upload your data, ask questions in plain English, and instantly generate publish-ready infographics. The core value proposition of StatPecker? It automates the drudgery of data reporting, empowering you to communicate with clarity and confidence while saving time and cutting out costly middlemen. Join the ranks of savvy professionals who are harnessing the power of StatPecker to elevate their data game and make an impactful impression.
Features of StatPecker
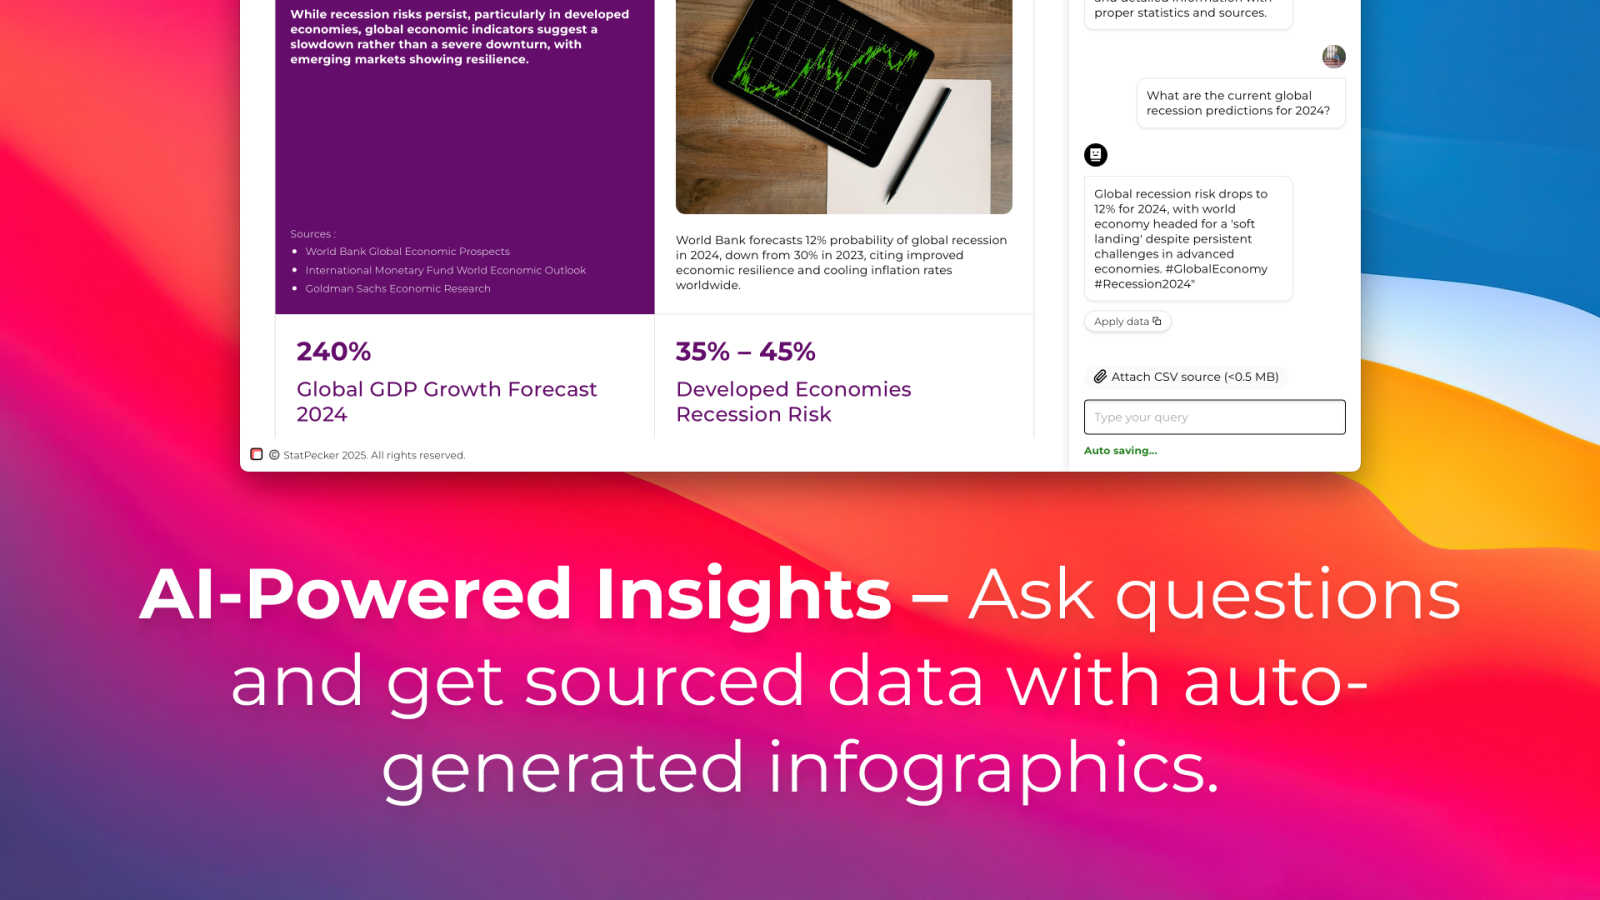
Ask Your Query
With StatPecker's intuitive AI, you can get instant insights from validated sources. No more wrestling with complex tools or software; just ask your question in plain language and let the magic happen. This feature makes it easy for anyone, regardless of their technical skills, to extract meaningful insights from their data.
Publish & Embed
Turn your visuals into interactive experiences that are easy to integrate into blogs, articles, and websites. StatPecker allows you to publish and embed your infographics seamlessly, making it a breeze to share your insights with your audience. This feature ensures your data storytelling is not just seen but also engaged with.
Upload & Analyze CSVs
Ditch the hassle of manual spreadsheet analysis. StatPecker lets you upload local CSV files and extracts key insights without breaking a sweat. This feature is perfect for those who want to quickly analyze data without getting bogged down in complex software, transforming raw numbers into captivating visuals in no time.
Download & Use Anywhere
Once you've created stunning infographics, StatPecker lets you export them as images for reports, presentations, and more. This feature provides the flexibility to use your visuals anywhere, ensuring your data storytelling is always at your fingertips, whether you're in a meeting or crafting a blog post.
Use Cases of StatPecker
Marketing Campaigns
Marketers can leverage StatPecker to visualize campaign performance metrics quickly. With just a few clicks, they can create engaging infographics that highlight key achievements, ROI, and audience engagement, making it easy to present compelling results to stakeholders.
Journalism on a Deadline
Journalists under tight deadlines can turn to StatPecker for fast and reliable data visuals. By simply uploading data and querying the AI, they can produce eye-catching graphics that complement their articles, making complex stories more digestible for readers.
Academic Research
Researchers buried in data can use StatPecker to simplify their findings. Instead of getting lost in spreadsheets, they can generate clear, impactful visuals that make their research accessible and understandable to a broader audience, enhancing their overall communication.
Educational Content Creation
Educators looking to make complex topics click can utilize StatPecker's capabilities to transform dry statistics into vibrant infographics. This approach not only aids in student comprehension but also makes learning more engaging and interactive.
Frequently Asked Questions
How does StatPecker work?
StatPecker uses advanced AI algorithms to analyze your data and generate visualizations based on your queries. Simply upload your data, ask your question in plain English, and let StatPecker do the heavy lifting.
Can I use StatPecker for free?
Yes! StatPecker offers a free tier that includes unlimited projects and embeds with manual edits, along with 25 AI queries and 10 CSV uploads. It's perfect for beginners or those who want to test the waters before committing.
Is there a limit to the number of visuals I can create?
With the free tier, you can create unlimited projects, but there are restrictions on the number of AI queries and CSV uploads. The paid plan offers unlimited access to all features, giving you the freedom to create as many visuals as you need.
What types of files can I upload to StatPecker?
You can upload local CSV files to StatPecker for analysis. The platform is designed to extract insights from these files easily, allowing you to generate visuals without the hassle of complex data manipulation.
Similar to StatPecker
Anime Maker
Create anime images, characters, logos, filters, and image-to-video concepts with AI.
ComicsMaker
AI comic generator that turns ideas, scripts, and prompts into polished comic panels and visual stories online.
InContekst
Decision support framework for high consideration businesses with mix of online and offline channels, content-rich sites, and long customer journeys.
AI Fruit
Generate viral AI fruit videos in seconds — talking fruit, ASMR cuts, and surreal hybrids.
GeoRank
Interactive maps comparing sunshine, taxes & cost of living across 190 countries at 0.5 degree precision. Free to start.
Screen Dub
Launch your next product demo without ever needing a mic. Record your screen or drop in a slide deck, you do the walking, and ScreenDub builds the per
Seedream AI Studio
Generate images with Seedream 5.0 and turn selected results into short videos in one browser workflow.