Master Metrics
Master Metrics transforms your data chaos into sharp dashboards and alerts, empowering you to crush your marketing.
About Master Metrics
Tired of drowning in a chaotic sea of spreadsheets, disconnected dashboards, and last-minute client report panic? Master Metrics is your life raft and rocket fuel combined. This isn't just another analytics tool; it's the all-in-one command center built by battle-hardened agency marketers for agencies and marketing teams who are done with the data grind. We get it—your time is better spent on strategy, not spreadsheet sorcery. Master Metrics cuts through the noise, pulling data from over 10+ sources like Google Ads, Meta, and your CRM into one slick, unified cockpit. Its core power is turning raw data into actionable intelligence and stunning client deliverables at lightspeed. From AI-generated Google Slides presentations to real-time budget alerts in Slack, it automates the tedious and amplifies your insights. Whether you're a solo freelancer juggling 15 accounts or a massive agency managing 250+, this platform is designed to maximize your results, simplify your workflow, and let you make data-driven decisions without breaking a sweat. Stop wrestling with data and start commanding it.
Features of Master Metrics
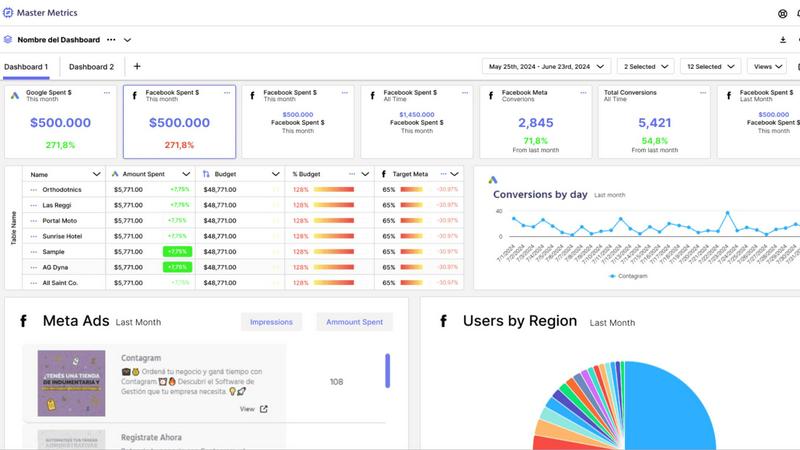
Smart Dashboards
Master Metrics transforms the way you visualize data with smart dashboards that make analytics a breeze. Customize your views to focus on the metrics that matter most. Whether you need a snapshot of your campaign performance or a deep dive into audience engagement, these dashboards bring clarity to the chaos.
Automated Alerts
Never miss a beat with automated alerts that keep you in the loop. Set up custom notifications for budget thresholds, goal achievements, or metric fluctuations. Receive alerts in your preferred channel, whether it’s email, Slack, or WhatsApp, so you can act swiftly and decisively.
AI-Powered Reporting
Creating stunning reports has never been easier. With AI-generated Google Slides presentations, you can whip up professional-looking reports in just a few clicks. Choose your data sources, select metrics, and let Master Metrics do the heavy lifting, freeing you to focus on strategy.
Account Management Control Panel
Manage multiple accounts seamlessly with our Overview Control Panel. This feature allows you to see all your accounts at a glance, pinpointing what needs your immediate attention. Customize your table, merge data from various sources, and streamline your workflow like a pro.
Use Cases of Master Metrics
Agency Performance Tracking
For marketing agencies, tracking performance across multiple clients can be daunting. Master Metrics allows agencies to consolidate data from various platforms, helping them identify trends, measure success, and refine their strategies effortlessly.
E-commerce Sales Monitoring
E-commerce businesses can leverage Master Metrics to monitor sales performance in real-time. With alerts for underperforming campaigns and sales dips, businesses can pivot strategies quickly, ensuring they stay ahead of the competition.
Budget Management
Managing marketing budgets can be tricky. With Master Metrics, users can set daily spend alerts to ensure they hit monthly targets without overspending. This feature enables proactive budget control, keeping finances in check while optimizing ad performance.
Client Reporting Made Easy
Freelancers and agencies alike can benefit from streamlined client reporting. With customizable templates and AI-generated presentations, you can deliver polished reports to clients in minutes, enhancing professionalism and saving valuable time.
Frequently Asked Questions
What data sources can I connect with Master Metrics?
Master Metrics can connect to over 10 data sources, including Google Ads, Meta, and various CRMs, allowing you to pull all your essential data into one place for streamlined analytics.
How does the automated alerts feature work?
You can set up custom alerts based on specific metrics or budget thresholds. When your data crosses these thresholds, you'll receive notifications via your chosen platform, ensuring you can act quickly when necessary.
Can I customize my dashboards?
Absolutely! Master Metrics offers extensive customization options for dashboards. You can choose which metrics to display and tailor the layout to focus on the data that matters most to your business.
Is there a free trial available?
Yes! You can try Master Metrics free for 7 days. This allows you to explore the platform’s features and see how it can transform your data management before committing to a paid plan.
Similar to Master Metrics
InContekst
Decision support framework for high consideration businesses with mix of online and offline channels, content-rich sites, and long customer journeys.
JustLaunched
The launch platform for indie makers — schedule your launch, get in front of buyers, and blast across directories.
GeoRank
Interactive maps comparing sunshine, taxes & cost of living across 190 countries at 0.5 degree precision. Free to start.